Annual Audit Manual
COPYRIGHT NOTICE — This document is intended for internal use. It cannot be distributed to or reproduced by third parties without prior written permission from the Copyright Coordinator for the Office of the Auditor General of Canada. This includes email, fax, mail and hand delivery, or use of any other method of distribution or reproduction. CPA Canada Handbook sections and excerpts are reproduced herein for your non-commercial use with the permission of The Chartered Professional Accountants of Canada (“CPA Canada”). These may not be modified, copied or distributed in any form as this would infringe CPA Canada’s copyright. Reproduced, with permission, from the CPA Canada Handbook, The Chartered Professional Accountants of Canada, Toronto, Canada.
7044.2 Eight step approach to performing statistical audit sampling
Sep-2016
In This Section
Characteristics of a statistical sampling
Eight steps approach to performing statistical sampling
Overview
This topic explains:
- The characteristics of a statistical sampling
- The eight step approach to performing statistical audit sampling addressing
- Using IDEA for Dollar Unit Sampling
- Practice aids for applying statistical sampling and documentation
- Frequently asked questions on statistical sampling
CAS Guidance
The decision whether to use a statistical or non-statistical sampling approach is a matter for the auditor’s judgment; however, sample size is not a valid criterion to distinguish between statistical and non-statistical approaches. (CAS 530.A9)
Statistical sampling — An approach to sampling that has the following characteristics:
(i) Random selection of the sample items; and
(ii) The use of probability theory to evaluate sample results, including measurement of sampling risk.
A sampling approach that does not have characteristics (i) and (ii) is considered non-statistical sampling. (CAS 530.5 (g))
OAG Guidance
In rare cases, we may find that it is either impossible or too costly to obtain audit assurance primarily from a combination of reliance on controls and analytical procedures. In such circumstances, we would look to audit sampling: statistical or non-statistical sampling.
Statistical audit sampling is an approach that relies on laws of probability for selecting and evaluating a sample in order to conclude on the population as a whole. The sample risk, i.e., the risk that the selected sample would not be representative of the population as a whole, is assessed using laws of probability.
The advantages of statistical sampling are:
- sample selection can be automated and is objective;
- computerized statistical tools are available (e.g., IDEA);
- provides a precise measure of sampling risk; and
- calculates the most efficient acceptable sample size (prevents over auditing).
OAG Audit 7044.1 presents CAS requirements and guidance related to audit sampling, including statistical or non-statistical sampling. These requirements and guidance are not repeated here. Auditors should refer to OAG Audit 7044.1.
For further guidance on non-statistical sampling, refer to OAG Audit 7044.1.
OAG Guidance
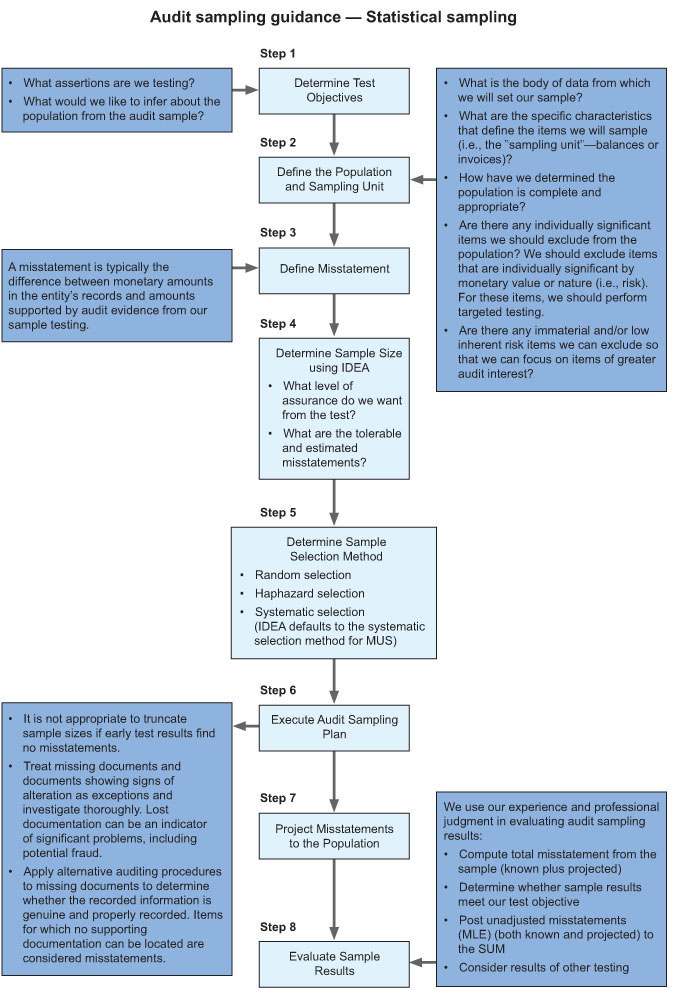
The eight step approach presented in OAG Audit 7044.1 is used when designing and executing the statistical sampling as well as when evaluating the results. These eight steps ensure consistency of application and ensure appropriate documentation. These are:
Step 1: Determine the test objective
Step 2: Define the population and sampling unit
Step 3: Define misstatement
Step 4: Determine sample size (determine the confidence level (or the sampling risk) for the procedure)
Step 5: Determine sample selection method
Step 6: Executing statistical sampling
Step 7: Assessing misstatements and projecting misstatements to the population
Step 8: Evaluation of sample results
Related guidance
Refer to further guidance on the eight step approach at OAG Audit 7044.1.
OAG Guidance
When our primary objective is to conclude in monetary terms, the OAG uses statistical sampling based on “dollar unit sampling” (DUS) techniques. The audit software tool used to assist auditors in the planning, extraction, and evaluation of statistical samples is IDEA.
Step 1: Determine the test objective
The test objective is a description of what we would like to infer about the population from the sample and is related directly to the financial statement assertion we are testing (e.g., existence, accuracy). We carefully identify the characteristic of interest (i.e., the corroborating evidence) that is consistent with the test objective.
Step 2: Define the population and sampling unit
Determine that the population we intend to draw our sample from is appropriate for the specific audit objective and is complete.
There is a natural tendency to designate an entire account balance or class of transactions as the population. However, the population can be restricted to the group of transactions for the time period relevant for the test and under the same system of controls that are relevant to the objectives of the test.
When determining the appropriateness of the population for the planned audit procedure, we consider:
-
The objective of the test.
-
The direction of testing. For example, if our objective is to test for overstatement of accounts payable, the population could be defined as the accounts payable listing.
Determine the physical sampling unit that we believe will lead to the most effective and efficient sampling application and that is relevant to our test objective. We test the entire sampling unit (i.e., we do not sample within the sampling unit). For example, if we select the customer account balance as the physical sampling unit and we do not receive a confirmation from a particular customer and that customer’s account balance is comprised of 25 invoices, we then use alternative procedures to test all 25 invoices to arrive at a valid conclusion.
Other factors to consider:
-
Individually significant items, either by nature (i.e., risk) or monetary value, are targeted tested when, in our judgment, acceptance of any sampling risk is not justified. These items are no longer considered part of the sampling population. IDEA automatically segregates high-value items (but not high-risk items) and does not extrapolate results.
-
Immaterial low-inherent risk items may be excluded from the population sampled. As a general rule, the aggregate of items would not exceed the SUM de minimis materiality threshold. When considering this approach, be sure to consider whether there is a risk of fraud or a risk of understatement before removing them from the population.
-
If you opt to exclude low risks and low monetary value items, consider whether you should perform analytical procedures and document your rationale for excluding these items from your population.
For further guidance on population and sampling unit, refer to OAG Audit 7044.1.
Step 3: Define misstatement
A misstatement is the difference between monetary amounts in the entity’s records and amounts supported by audit evidence from our sampling application. A clear misstatement definition, prior to executing the sampling plan, is essential and needs to be accurate (not too narrow or too broad) in order to result in effective sampling. For example, we would not ordinarily consider observed differences to be misstatements if they are explainable and supportable by the circumstances (e.g., timing differences for confirmations). When we use audit sampling, generally our primary concern is overstatement.
Step 4: Determine sample size
When using IDEA for DUS (called Monetary Unit Sampling or MUS in IDEA), there are four settings that need to be entered. Using these settings, IDEA provides an estimate of the required sample size and sampling interval for concluding on the sampled population. It is important to note that these values are estimates, and that the sample size may have to be extended based the auditor’s testing of the sampled items.
Value of the sampled population
This value can either be entered directly, or computed from an open database. However, if any items are extracted from the population for separate testing, such as identified key items or high-value items, the value entered should be reduced by their combined amount.
Desired level of evidence (Confidence level)
The extent of testing will be performed at one of four levels: 90 percent for high level of assurance, 75 percent for moderate level of assurance, 50 percent for low level of evidence, and 33 percent for supplemental level of assurance.
Tolerable Misstatement (Performance materiality or materiality for particular items (if determined))
This is the highest amount of monetary error that is acceptable for the current test.
Expected misstatement (Expected error)
This is the total value of errors we expect to find in the population being sampled, excluding key or high-value items that are evaluated separately. For example, there may be, and in fact will likely be, different expected errors whether you are sampling a payroll cycle or inventory cycle. The expected error is based on professional judgement, including consideration of historical experience, and assessed risk.
In order to be efficient, the expected misstatement should be less than one half the tolerable misstatement amounts. Consult Audit Services when the aggregate of the haircut and the expected misstatement for a particular sample population is greater than 50 percent of overall materiality.
Step 5: Determine sample selection method
There are two sample selection methods provided by IDEA. Both methods select one item from every interval across the entire dollar population:
-
Random selection (IDEA: cell selection): a hit dollar is randomly selected within each interval
-
Systematic selection (IDEA: fixed interval): a hit dollar is randomly selected within the first interval and then the sampling interval is applied from that point on to select the same dollar in each successive interval
The default option in IDEA is systematic selection. However, if there are any concerns of periodicity (i.e., regular patterns in the data), random selection is more appropriate. For further guidance on selection method, refer to OAG Audit 7044.1.
Step 6: Executing statistical sampling
OAG Audit 7044.1 explains what to do when we have voided items in our sample, when third parties do not respond to a request of confirmation, or specified documents cannot be located in the client’s files (unlocatable documents), and when a sample includes an item that has not been used (unused items). Refer to OAG Audit 7044.1 for further guidance on these particular situations.
Step 7: Assessing misstatements and projecting misstatements to the population
Only in “extremely rare” circumstances do we consider sampling differences to be an anomaly and, therefore, not projected for the purposes of inclusion in the SUM. Instead we perform additional audit procedures to obtain a high degree of “certainty” that these differences do not affect the remainder of the population and are, therefore, not representative. This implies significant rigour and requires a high degree of assurance.
Further to investigating differences, the CAS provides useful guidance discussing considerations for analyzing deviations and misstatements. These considerations include looking for common features, for example, type of transaction, location, product line, or period of time. In such circumstances, we may decide to identify all items in the population that possess these common features, and extend audit procedures to those items. By stratifying populations based on common characteristics, we are able to focus our procedures on probable risks and possibly identify a strata of the original population for which the misstatements are representative and, therefore, projected.
Errors identified during the testing of a DUS sample should always be projected to the population subject to testing, using the appropriate methodology. Teams should use IDEA for this purpose. IDEA automatically projects misstatements found in the sample to the population audited. In the conclusion of the evaluation of results, the most likely total overstatement and the most likely total understatement of the population will be provided. These are the values to be carried forward to the SUM as the likely (projected) differences.
Step 8: Evaluation of sample results
Regardless of the sampling approach used, we are required to evaluate the results of our audit sample to determine if we have obtained a reasonable basis for conclusions about the population that has been tested. Refer to OAG Audit 7044.1, step 8, for guidance on evaluating sample results.
OAG Guidance
Audit teams are encouraged to consult with the OAG Internal Specialist of Research and Quantitative Analysis when performing DUS sampling using IDEA.
A Data Analytics specialist is also available to support IDEA data extractions for the purposes of carrying out substantive tests of detail and/or systems analytics. A Data Analytics specialist can be contacted to provide more information on the use of IDEA.
The following flowchart captures the key points from each of the eight steps in performing statistical audit sampling.
OAG Guidance
This Statistical Sampling—Frequently Asked Questions (FAQ) document has been prepared to provide the auditor practical answers to frequently asked questions on statistical sampling in an annual audit. This FAQ is to be used in conjunction with the policies and guidance of OAG Audit 7044, OAG Audit 7044.1 and OAG Audit 7044.2.